
Stephen Byrn, Pamela Smith, David Engers
Comparability intended to describe the sameness of amorphous materials can be assessed in a scientifically and pharmaceutically meaningful way. More specifically, it addresses how amorphous drug substances or amorphous drug products can be compared with respect to identity, strength, quality, purity, and potency. This approach is important since it is well established that amorphous materials prepared by different methods or from different sources can exhibit different properties and behaviors, including differences in stability, crystallization tendency, molecular mobility, and dissolution performance. Those differences may, in turn, affect pharmaceutical performance and therapeutic response. Accordingly, this blog outlines an approach for determining whether different amorphous materials are truly similar or whether they are meaningfully different materials that should be distinguished analytically and pharmaceutically. Comparability of amorphous systems is discussed extensively in the Solid-State Chemistry books of Byrn and co-authors (1-4).
In this blog, amorphous materials are compared using a reference versus test strategy in which three independent lots are evaluated. This type of approach is appropriate because amorphous materials can differ in physical identity, molecular mobility, stability, and performance, and therefore should be compared using multiple solid-state characterization methods rather than chemical testing alone. A typical procedure begins with reviewing the data from each lot to determine whether any major differences can be detected. If significant variations are observed, the comparability of the lots is called into question, which motivates further evaluation. If no major variations are identified, the data from the three lots for each process are averaged and the standard deviation is calculated. In some cases, additional point-by-point comparisons are also performed to determine whether the reference and test materials differ in any meaningful way.
Primary Structural Comparability Tests
Three primary structural comparability tests are envisioned.
-
Pair Distribution Function (PDF)
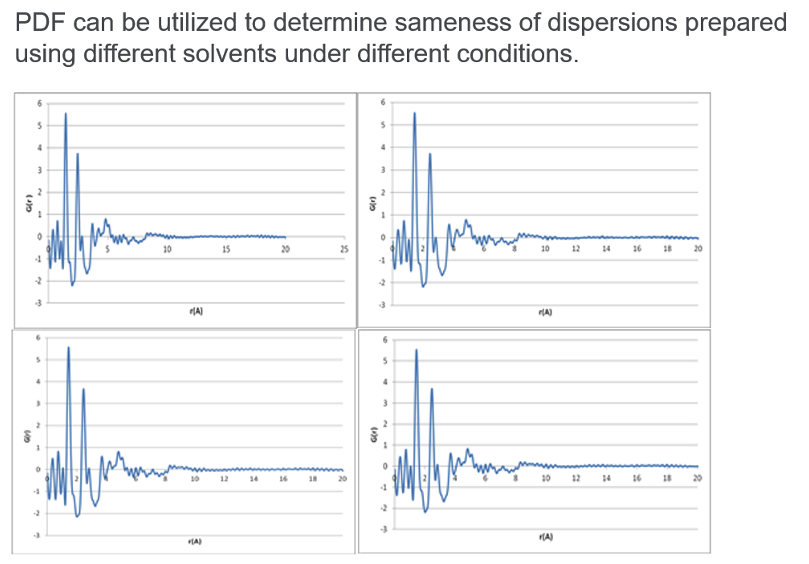
First, a comparability study based on synchrotron XRPD and PDF analysis is recommended. For this study, three independent capillary packings are prepared for each material, and each capillary is analyzed at 10 positions using a count time of 200 seconds, or another justified acquisition time, per position. The data should be extracted and processed in the same manner for all samples, and no smoothing should be applied. This approach is appropriate because XRPD/PDF converts diffuse amorphous scattering into a more structurally informative fingerprint to describe short range order (e.g., real space distances, ) that has been used to compare amorphous materials prepared by different manufacturing routes.(5)
The resulting data can then be compared using the average-and-standard-deviation approach described in the referenced AAPS poster.(6) In this approach, the PDFs from the 10 positions within each capillary are averaged, and the corresponding standard deviation is calculated to estimate within-capillary variability. The data from the three capillaries are then compared in the same way, using averages and standard deviations to estimate overall variability and identify meaningful deviations between the reference and test materials. This type of analysis is consistent with the broader solid-state principle that amorphous materials must be evaluated through careful physical characterization to determine whether process differences produce meaningful structural differences that could affect performance.
Alternative or complementary data analysis strategies include calculating the root mean square error (RMSE) between PSDs. Point-by-point RMSE comparison of PDFs provides a single quantitative measure of the difference between a reference and test PDF of an amorphous material across a defined -range. At each – value, the difference between the reference and test PDF intensities is calculated, squared, averaged across the comparison range, and square-rooted. Low RMSE values indicate that the two PDFs are highly similar, whereas larger values indicate greater structural deviation. In practice, RMSE should be interpreted relative to the within-sample and within-product variability established from replicate measurements and independent capillary packings.
Another alternative is the principal component analysis (PCA) method to compare PDFs. PCA of PDF data should be performed by treating each reduced PDF curve as a multivariate fingerprint in which the PDF intensity at each common -value is a variable. The analysis should be conducted using PDFs generated under identical acquisition and reduction conditions, with all curves placed on the same -grid and mean-centered before PCA. Score plots should be examined to determine whether replicate positions, capillaries, and products cluster together or separate, and loading plots should be used to identify the -regions responsible for any observed separation. PCA should be interpreted relative to within-capillary and within-product variability and used as a secondary assessment of structural sameness rather than as a stand-alone acceptance criterion.
Both the RMSE and the PCA method can provide a useful secondary assessment of structural sameness and help identify subtle differences not readily apparent from visual inspection alone.
For the comparison using mean and standard deviation: the average PDFs from independent packings and lots should be comparable, with deviations that do not exceed the variability established for the reference material from replicate measurements, independent packings, and lot-to-lot analysis over the predefined -range.
-
Thermal Analysis
Thermal analysis is performed by differential scanning calorimetry (DSC) at a heating rate of 10°C/min using a standard DSC method. In many cases, modulated DSC can be useful to separate the reversing and non-reversing heat flow signals. The glass transition temperature ( ) of the material is measured, and the for the test sample is required to fall within ±3°C of the average established for the relevant lots or reference lots. Heating during the DSC test presents thermal stress to the specimen. The absence of a crystallization exotherm indicates that the material does not undergo measurable crystallization under the conditions used for the test. The absence of a melting endotherm is taken as evidence that no detectable crystalline material is present, either generated during heating or in the as received sample.
-
Solid-State NMR or Raman Mapping
Raman mapping or solid-state NMR may be used as a suitable orthogonal method for assessing comparability and confirming the absence of meaningful structural heterogeneity. For solid-state NMR, the spectra of the test and reference materials should be comparable, with corresponding chemical shifts matching within ±2 ppm, or within another scientifically justified limit established for the method and material. For Raman mapping, maps should be collected of the lots and carefully interrogated for the presence of any domains. The most amorphous systems will show no crystalline domains and no evidence of phase-separated domains. Samples prepared in different ways can exhibit differences with respect to domains.(7,8)
Together, these orthogonal methods provide additional evidence that the material remains amorphous and structurally uniform, which is consistent with the broader solid-state principle that amorphous materials should be characterized by more than one physical method.
Other Supporting Tests
-
Loss on Drying
Loss on drying (LOD) is measured for each of the three lots. The LOD result for each lot should not deviate by more than one standard deviation from the mean LOD. LOD measures the loss of sample mass but is not specific to the volatile(s) released, which may include water, organic solvents or compound sublimation or decomposition. If needed, techniques such as gas-phase chromatography, NMR, and/or Karl Fischer (KF) titration can be used to identify the volatile component.
-
Assay and Related Substances
Assay and related substances testing are carried out using a standard stability-indicating HPLC method. The assay result for each lot should be within the established specification. In addition, no new impurities above the reporting threshold should be observed, and there should be no meaningful change in the impurity profile relative to the reference material or historical data. This chemical testing, including identity, purity, and potency, can help to verify that the manufacturing process has not introduced significant chemical changes or new impurity-related risk. Because chromatographic methods assess chemical composition after dissolution, they should be used together with solid-state methods when establishing comparability of amorphous materials.
-
Performance Test – Dissolution
Evaluate dissolution performance of the amorphous material using either intrinsic dissolution rate (IDR) or a discriminating dissolution test method of the amorphous bulk lot and/or the finished drug product containing an amorphous active. IDR is particularly useful for comparing amorphous material under controlled surface-area conditions, while non-sink dissolution can be especially informative for amorphous materials because it captures supersaturation behavior, apparent solubility, and precipitation tendency. In some cases, dissolution profiles should be compared using the F2 strategy, a model-independent, FDA/EMA-recommended approach for comparing dissolution. Acceptance criteria for the amorphous material: the dissolution or IDR profile should fall within the established historical reference range, with no statistically significant shift in rate, extent, or profile shape relative to the reference material. These criteria are intended to confirm that any differences in solid-state properties do not produce a meaningful change in dissolution behavior. Because dissolution can be sensitive to polymorphism, amorphous content, particle size, and related solid-state factors, it is an important part of comparability assessment for both drug substances and drug products.
-
Stability
Evaluate one representative lot of each sample under 25°C/60% RH and 40°C/75% RH storage conditions for 1 month and 3 months. At each time point, assess the samples for physical and chemical stability using XRPD/PDF, DSC, dissolution, and impurity testing, as appropriate. This approach is consistent with the broader solid-state framework outlined in references 1 – 4, which emphasizes that amorphous materials should be monitored for physical stability – crystallization, changes in , dissolution changes – and chemical instability during stress conditions. Acceptance criteria are:(1) no detectable crystallization by XRPD/PDF; (2) change not exceeding ±3°C from initial; (3) dissolution remaining within ±10% of the initial profile at matched time points; and (4) no new (or increasing) impurity levels above established thresholds. These criteria are intended to detect storage-induced crystallization, changes in molecular mobility, loss of dissolution performance, and emerging chemical instability.
Conclusion
The materials will be considered comparable, and therefore the same, if all predefined acceptance criteria are met; no new solid-state crystalline phases or phase-separated regions are detected; and the observed lot-to-lot differences and measured performance attributes remain within the established variability of the reference material, as defined by the mean and standard deviation or by another justified statistical measure. This approach is consistent with the solid-state principle that amorphous materials must remain free of detectable crystallization, carefully characterized by orthogonal methods, and controlled so that any process-related differences do not produce meaningful changes in physical or chemical stability, release rate by dissolution, or other established pharmaceutical performance attributes.
References
- Byrn, S.R., Solid state chemistry of drugs. Academic Press, 1982.
- Byrn, S.R., Pfeiffer, R.R., Stowell, J.G., Solid State Chemistry of Drugs. 1999: SSCI, Inc.
- Byrn, S.R., G. Zografi, and X.S. Chen, Solid-state properties of pharmaceutical materials. 2017: John Wiley & Sons.
- Byrn, S.R., G. Zografi, and X.S. Chen, Solid-State Materials in Pharmaceutical Chemistry: Properties, Characterization, and Applications. 2025: John Wiley & Sons.
- “A high-energy x-ray diffraction study of amorphous Indomethacin” C. Benmore, S. Benmore, A. Edwards, C. Shrader, B. Harish, B. Cherry, P. Smith, F. Gozzo, C. Shi, D. Smith, J. Yarger, S. Byrn, R. Weber, J Pharm Sci., 111(3), 818-824 (2022).
- Novoa de Armas, H., Brewster, M., Beckers, D., Gateshki, M., Benmore, C., & Byrn, Stability and comparability of an amorphous drug prepared by different spray drying processes: Atomic pair-wise distribution functions (PDF) using conventional X-ray diffraction versus high energy synchrotron radiation, presented at AAPS PharmSci 360 (2018)
- L. Smith, D. Smith, P. Smith, D. Purcell, S. Bogdanowich-Knipp, S. Parent, S. Byrn, The Use of Raman Mapping and Hot-Stage Microscopy to Detect Micro-Domains of Crystallinity in Amorphous Solid Dispersions of Nilotinib, presented at AAPS PharmSci 360 (2025) (AAPS Special Collection Honor)
- K. Chen, P. Smith, N. Swarnakar, D. Engers, S. Bogandowich-Knipp, R. Alajlouni, S. Tiwari, Critical Insights Into High Drug Load Amorphous Formulations: Challenges and Advanced Techniques, presented at AAPS PharmSci 360 (2025)