Differential Scanning Calorimetry (DSC) is a primary analytical technique used throughout drug development. It’s used in the Drug Discovery and Preclinical stages as the gold standard for determining melting point. It’s also an essential tool for solid-state (polymorphism) studies, as outlined in ICH Q6A. In addition to melting point, DSC can provide information on enantiotropic/monotropic relationship of forms, and amorphization (Tg).
Traditionally, DSC testing is conducted in the “macro” mode and uses approximately 5 mg of material. With DSC hot-stage microscopy, the same information can be obtained on a single grain or particle. Combining the DSC technique with hot stage optical microscopy (HSOM) allows two tests to be done at the same time on the same particle. HSOM provides visual information about the thermal event actually occurring during the observed DSC events. DSC hot stage microscopy is the ideal analytical characterization tool when sample is extremely limited, as is often the case in early stage development when microscopy-based screens are a material-saving approach.
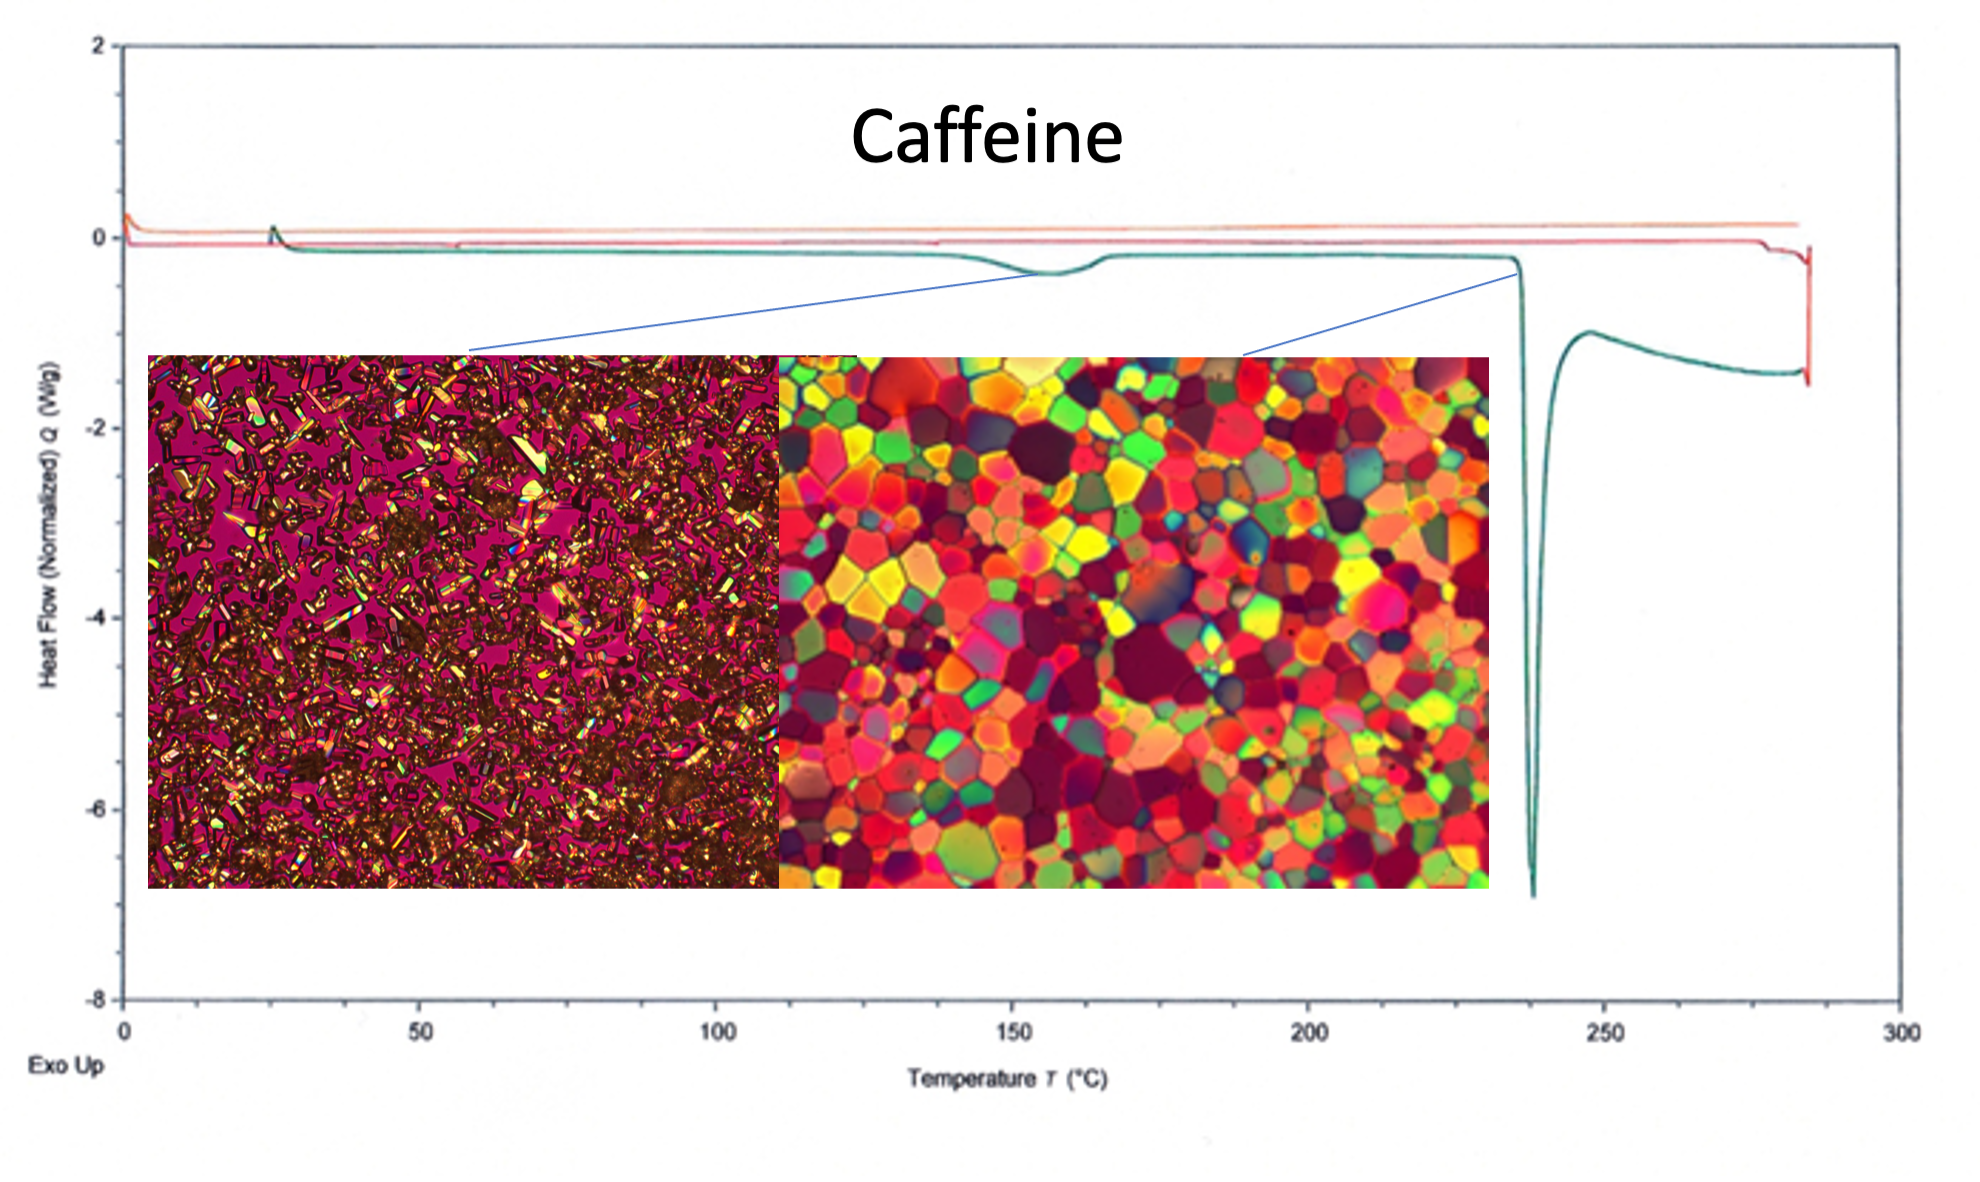 Figure 1. DSC curve and HSOM images showing solid form change from Form II to Form I at 155.2 °C (left image) and melting point at 238.8 °C (right image).
More about the micro-DSC hot stage system:
The micro-DSC hot stage system consists of a computerized control unit and a DSC hot stage, which not only controls the temperature but can produce photomicrographic or videographic observations of the sample while simultaneously measuring the DSC heat flow. Both qualitative and quantitative information on chemical or physical changes in the sample can be obtained. The samples are measured in glass or sapphire crucibles with transmitted light microscopical analyses, but also in aluminum crucibles for reflected light microscopical analyses. As a result, the micro-DSC need not necessarily be used with the microscope but can be used as a mini-DSC.
The micro-DSC may be controlled manually using a handset or automatically programmed in isothermal or temperature ramping modes from about 20 °C up to ~350 °C. In addition to determining the melting point of a substance, the micro-DSC hot stage may be used to investigate solid-solid form transformations, phase changes, sublimation, purity, desolvation, and liquid crystal phases, to name a few thermal analyses.
Thermal transitions are the changes that take place when a substance is heated. The temperature at melting (Tm) of a crystalline compound and the glass transition (Tg) are examples of thermal transitions. A DSC consists of two sample crucibles. In the specimen crucible, the crystalline material is loaded. The other crucible is the reference crucible and is normally kept empty. These two crucibles are located on top of precisely controlled heaters. The computerized control assembly will turn on the heaters and the heating rates (q/t) of the two crucibles are accurately controlled (i.e., 0.1 to 20 degrees Celcius per minute). The computer programs the heating rate to stay exactly the same throughout the experiment. The presence of crystalline material in the specimen crucible results in an uptake of more heat in order to keep the temperature of the specimen crucible increasing at the same rate as the reference crucible. This means that the heater underneath the specimen crucible will provide more heat energy than the heater under the reference crucible. A DSC experiment is the measure of “how much” heat the specimen crucible heater has to produce as compared to the heat produced by reference crucible heater. In a DSC experiment, the data of temperature (T) increase are plotted against the difference in heat output of the two heaters.
The data analysis software provides plots of the difference in heat output of the two heaters against temperature as illustrated in Figure 1. This means that the above plot is the heat absorbed by the specimen against temperature.
Heat / time = q/t = heat flow
The amount of heat it takes to get a certain temperature increase in a material is called heat capacity. A DSC thermogram plots the specimen heat capacity at a specific temperature.
When we divide the heat flow by the rate of heating, we obtain heat capacity (Cp):
Temperature increase/ time = ∆T/t = heating rate
(q/t) / (∆T/t) = q/∆T = Cp = heat capacity
ASTM Standard D3418-15, (2015), “Standard Test Method for Transition Temperatures and Enthalpies of Fusion and Crystallization of Polymers by Differential Scanning Calorimetry,” ASTM International, West Conshohocken, PA, 19428-2959.
ASTM Standard F766-82 (2001) e1, (2000), “Standard Test Method for Melting Point of Waxes,” ASTM International, West Conshohocken, PA, 19428-2959, DOI: 10.1520/F0766-28R00E01, www.astm.org