Pharmaceutical materials can exist in a crystalline or amorphous state. Figure 1 illustrates the crystalline state as a perfectly ordered solid with molecules (circles) packed in an orderly array. Figure 1 also illustrates an amorphous material as a disordered material with only short-range order. Crystalline materials give an X-ray diffraction pattern because Bragg planes exist in the material. Amorphous materials do not give a diffraction pattern of Bragg peaks. There are many interesting cases where a pharmaceutical material shows an intermediate degree of order falling somewhere between the highly ordered crystalline and disordered amorphous states. From a thermodynamic point of view, crystalline materials are more stable but the rate of transformation of amorphous materials to crystalline materials can be highly variable.[1]

Figure 1. Idealized view of crystalline (left panel) and amorphous (right panel) material. In this two dimensional figure the molecules are viewed as circles
It is possible to make a “Top 10” list of the differences between crystalline and amorphous materials. Crystalline materials are:
- Higher Purity
- More physically and chemically stable
- crystalline hydrate > anhydrous crystal > amorphous
- Lower solubility
- Narrow and (usually) higher melting point range
- Harder
- Brittle – slip and cleavage
- Directionally dependent properties – anisotropy
- Less compressible
- Better flow and handling characteristics
- Less hygroscopic
Amorphous forms can convert to crystalline forms by crystallization. Thus, it is important to understand physical stability and these physical interconversions. Amorphous forms can also take up water and then transform into a crystalline form. [2]
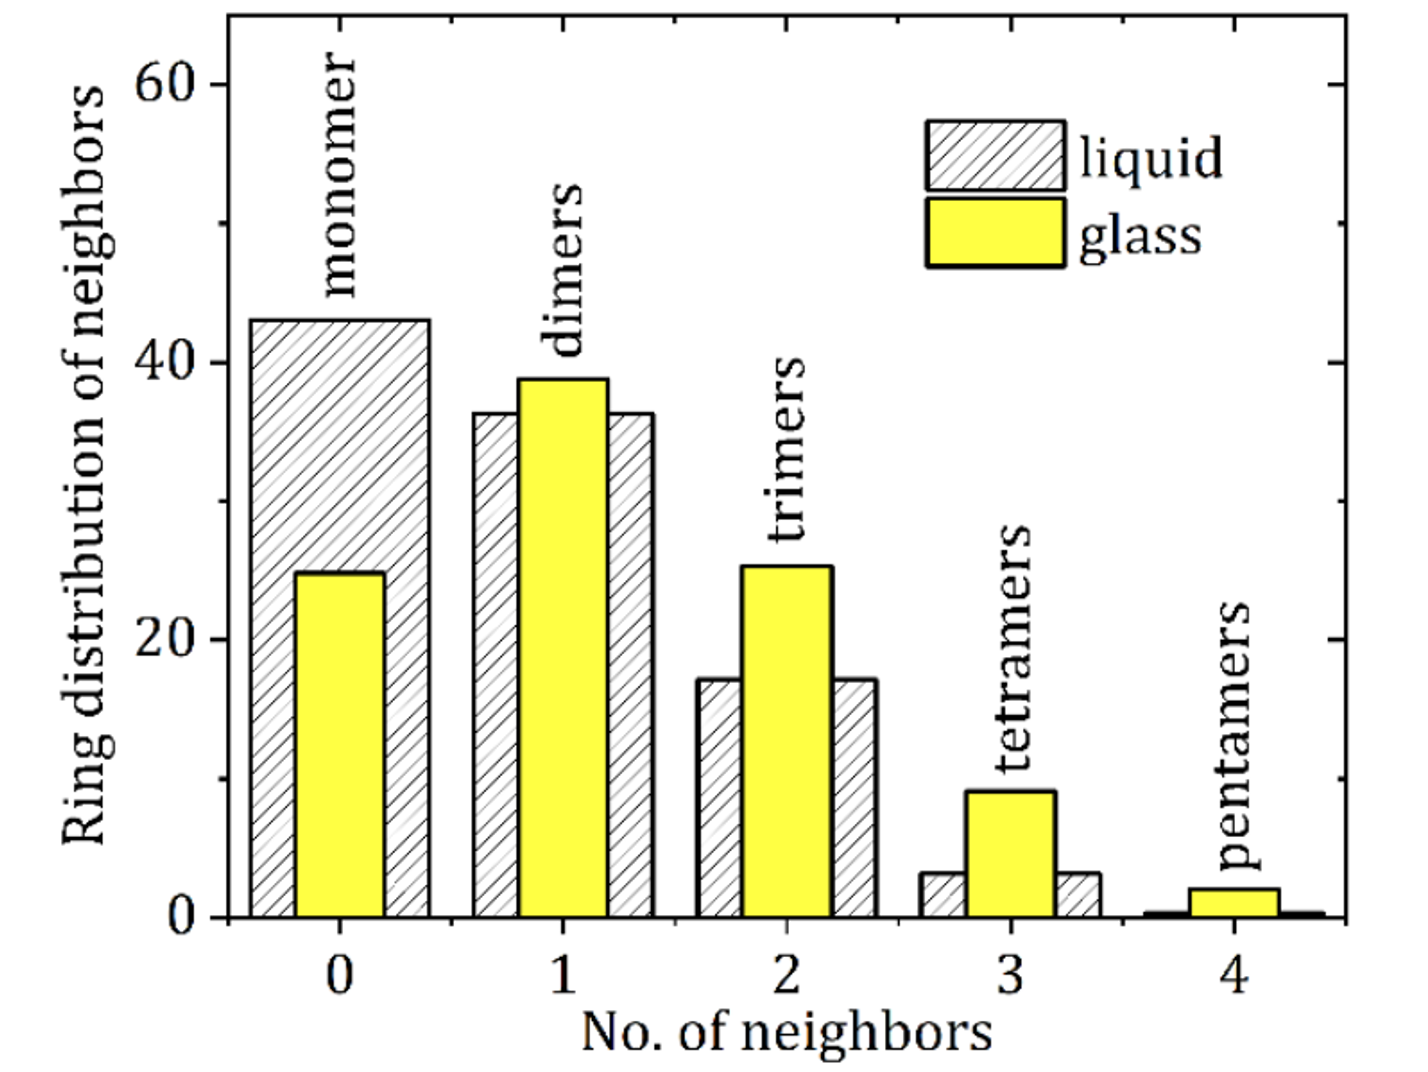
Although, in theory, amorphous forms have no structure, Synchrotron Pair Distribution Function (PDF) analysis indicates that some amorphous drugs contain domains of molecules including dimers (two nearest neighbors, NN), trimers (three nearest neighbors (NNN), tetramers (four nearest neighbors, NNNN) and perhaps even a pentamer (NNNNN). Figure 2 shows the results of a Synchrotron PDF study combined with an Empirical Potential Structural Refinement (EPSR) analysis of melt quenched and liquid carbamazepine. This figure shows that amorphous carbamazepine exists in small clusters of drugs up to pentamers (NNNNN). Interestingly, this study also shows that liquid carbamazepine contains fewer of the pentamers, NNNNN, and more of the monomers as would be expected. This study used an average N-O cut-off distance of 4.0 Å.[3]

Figure 2. The number of monomers (N), dimers (NN), trimers (NNN), tetramers (NNNN), and pentamers (NNNNN) in liquid and amorphous (glass) carbamazepine.
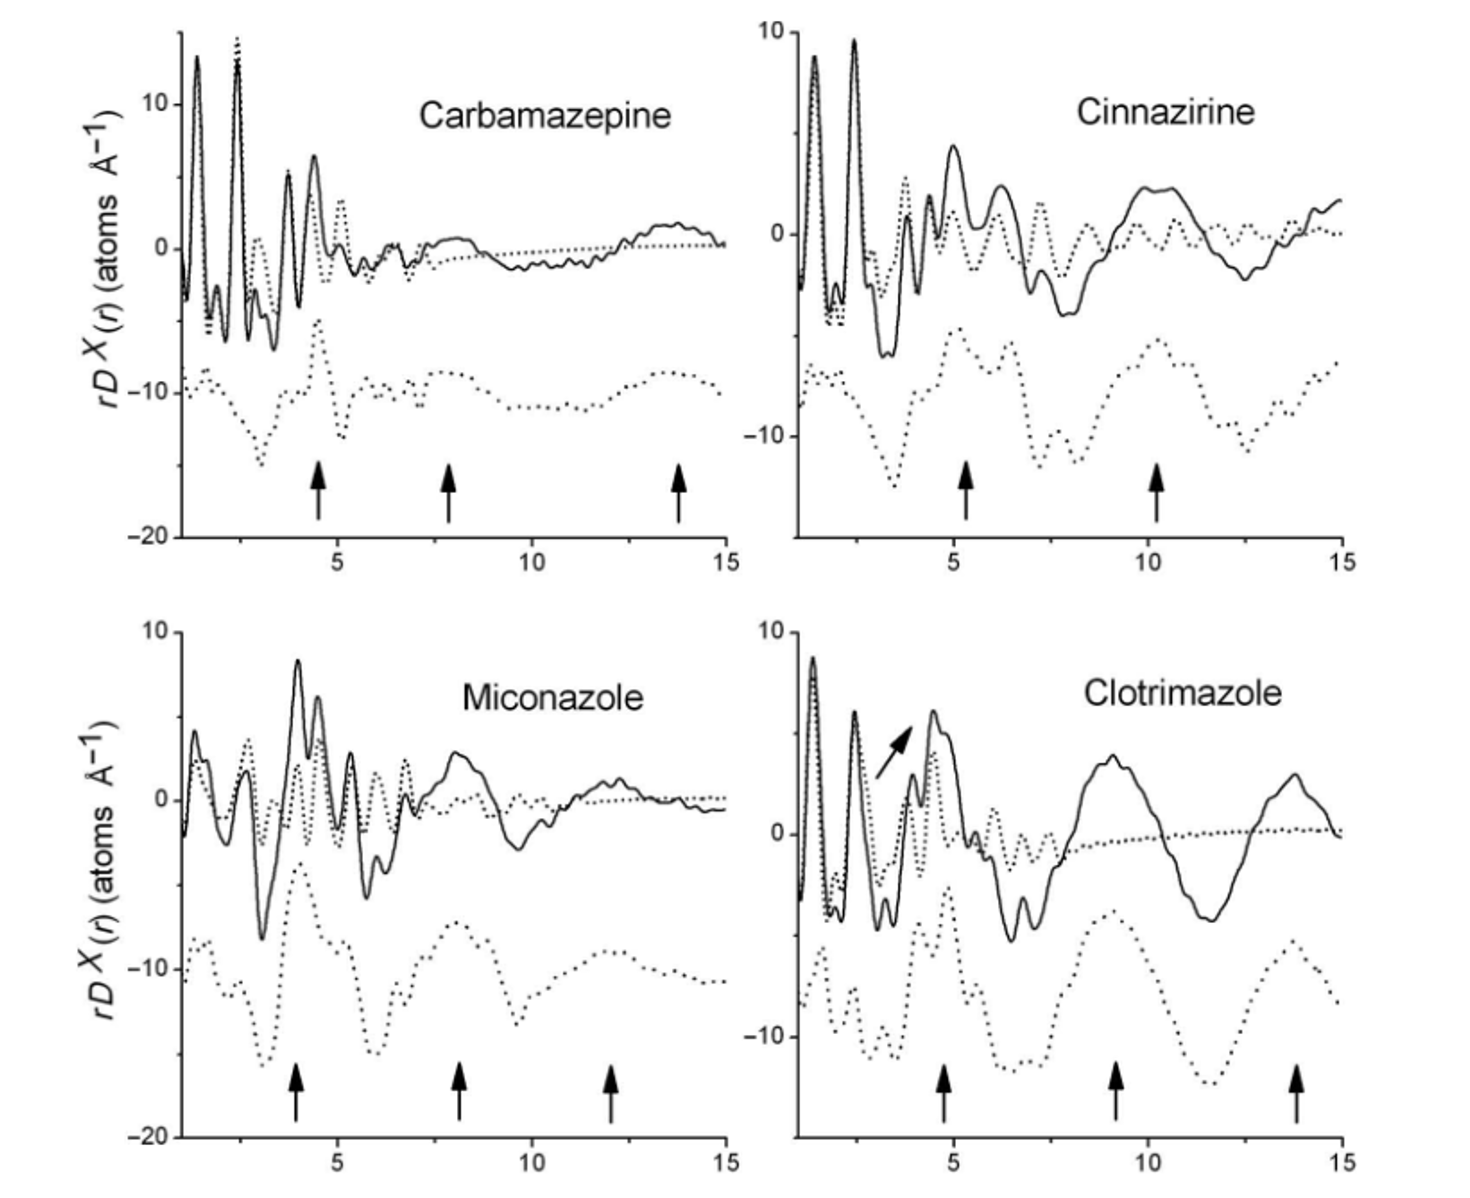
In an earlier study, the differential PDF calculated by subtracting the intramolecular PDF from the overall PDF for carbamazepine, cinnarizine, miconazole, and clotrimazole, showed that amorphous carbamazepine had weak intermolecular interactions at 4.5. 7.8 and 13.6 Å. In contrast, cinnarizine and clotrimazole showed strong intermolecular interactions at above 10 Å as shown in Figure 3.[4] Additional studies are planned to further correlate the combined PDF-EPSR studies with the intermolecular PDF profile.

Figure 3. The measured total X-ray differential pair distribution function multiplied by r to highlight the medium-range interactions rDX(r) (solid lines) compared with the intramolecular curves rDXintra(r) calculated from the crystal structures. The difference between the solid and dotted lines corresponds to the intermolecular pair distribution function rDXinter(r).[4]
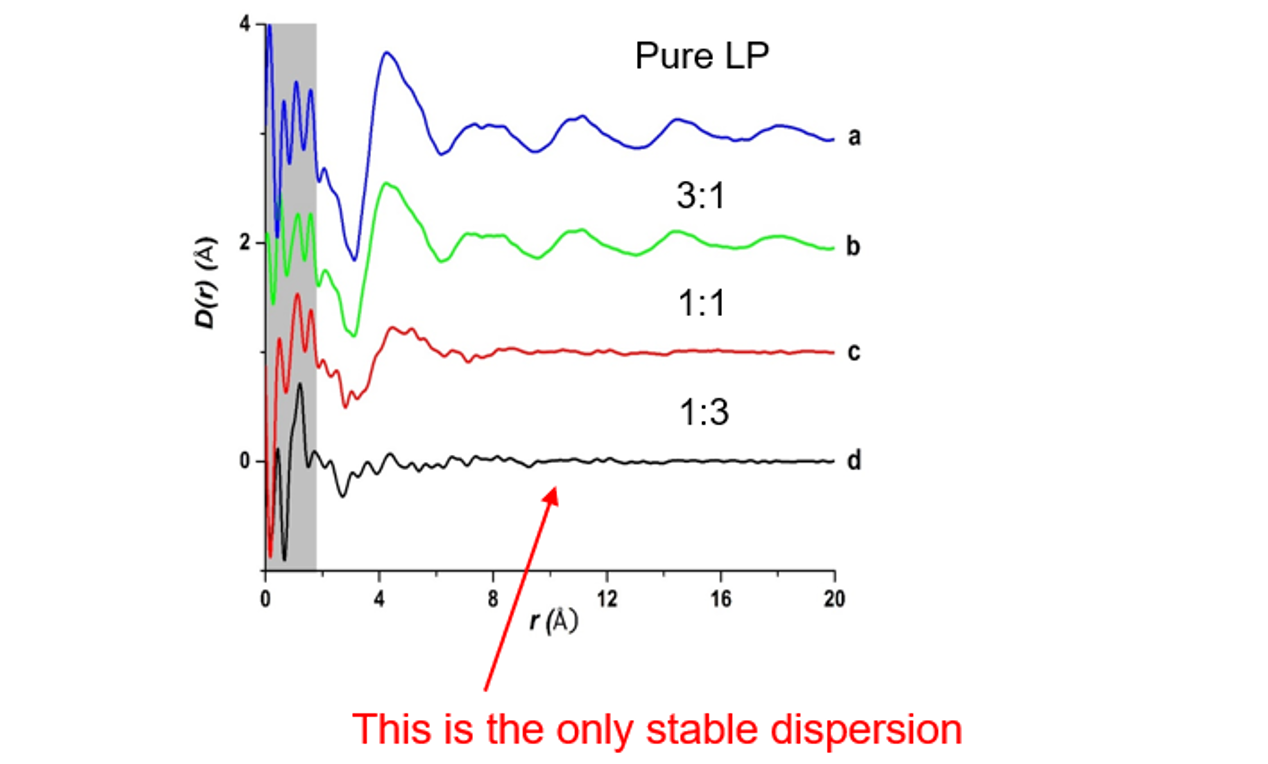
A study of lapatinib showed that its amorphous form had long range structure and domains out to NNNNN. In this study the differential pair distribution function (DXinter) was calculated by subtracting the intramolecular pair distribution function (DXinter) from the total pair distribution function. Figure 4 shows the results of this study. The top tracing is the differential pair distribution function (DXinter) for pure amorphous lapatinib and shows long range order and domains out to about 20 Å. The remaining differential pair distribution functions show that increasing amounts of HPMCP polymer in a lapatinib:HPMCP amorphous dispersion destroyed the domains originally present in pure amorphous lapatinib. As noted in the figure, the amorphous mixture of lapatinib and HPMCP (1:3 w/w) without domains was more stable towards crystallization than the other mixtures suggesting that crystallization is favored if domains of the drug are present.[5, 6] This observation is consistent with the idea that the groups of molecules in the amorphous system favor crystallization.

Figure 4. The differential pair distribution function (DXinter) top tracing and mixtures of 3:1, 1:1, and 1:3 w/w of lapatinib and the polymer HPMCP.
It is interesting to note that Solid State NMR has also been used to determine the structure of amorphous drugs. In collaboration with Merck scientists, our group showed that amorphous posaconazole contained local head-to-tail packing.[7] In another study the amorphous drug AZD5718 was analyzed using dynamic nuclear polarization-enhanced solid-state NMR experiments. These experiments were consistent with local intermolecular complex formation.[8] They indicated that for this drug, the structure of the amorphous compound is broadly similar to its crystalline counterpart [8]
In a paper entitled NMR Crystallography of Molecular Organics, Hodgkinson concluded from methyl group chemical shifts that the amorphous form of the drug tenapanor has a similar conformational distribution to the salt form. [9]
In conclusion, it is clear that both PDF and NMR studies will reveal more about the structure of amorphous materials as time goes on. Advanced modeling techniques such as EPSR are revolutionary for visualizing the 3D-dimensional arrangement of the molecules in disordered forms. These new studies have promise to provide important structural information of amorphous materials and at the same time explain their properties such as propensity for crystallization.
For information on how these sorts of studies can be conducted, please visit Structure of amorphous formulation at the angstrom level using PDF | Improved Pharma.
References
- Van Eerdenbrugh, B., J.A. Baird, and L.S. Taylor, Crystallization tendency of active pharmaceutical ingredients following rapid solvent evaporation—classification and comparison with crystallization tendency from under cooled melts. Journal of pharmaceutical sciences, 2010. 99(9): p. 3826-3838.
- Andronis, V., M. Yoshioka, and G. Zografi, Effects of sorbed water on the crystallization of indomethacin from the amorphous state. Journal of pharmaceutical sciences, 1997. 86(3): p. 346-351.
- Benmore, C.J., et al., The Structure of Liquid and Glassy Carbamazepine. Quantum Beam Science, 2022. 6(4): p. 31.
- Benmore, C.J., et al., Structural characterization and aging of glassy pharmaceuticals made using acoustic levitation. Journal of pharmaceutical sciences, 2013. 102(4): p. 1290-1300.
- Bezzon, V.D., et al., Amorphous dispersions of flubendazole in hydroxypropyl methylcellulose: Formulation stability assisted by pair distribution function analysis. International Journal of Pharmaceutics, 2021. 600: p. 120500.
- Tian, B., X. Tang, and L.S. Taylor, Investigating the correlation between miscibility and physical stability of amorphous solid dispersions using fluorescence-based techniques. Molecular pharmaceutics, 2016. 13(11): p. 3988-4000.
- Lu, X., et al., Molecular mechanism of crystalline-to-amorphous conversion of pharmaceutical solids from 19F magic angle spinning NMR. The Journal of Physical Chemistry B, 2020. 124(25): p. 5271-5283.
- Cordova, M., et al., Structure determination of an amorphous drug through large-scale NMR predictions. Nature Communications, 2021. 12(1): p. 2964.
- Hodgkinson, P., NMR crystallography of molecular organics. Progress in Nuclear Magnetic Resonance Spectroscopy, 2020. 118: p. 10-53.
