Raman mapping is a non-destructive surface imaging technique that involves sequential measurements on adjacent regions of a sample by point-by-point scanning where at each step in the map, a Raman spectrum is acquired. The information in the collected spectra is used to build a detailed chemical image of the tested specimen by interrogating the data and generating a false-color image representing the unique composition and concentration of the components of the material being tested.
Raman Mapping Application One: Chemical Mapping-single product
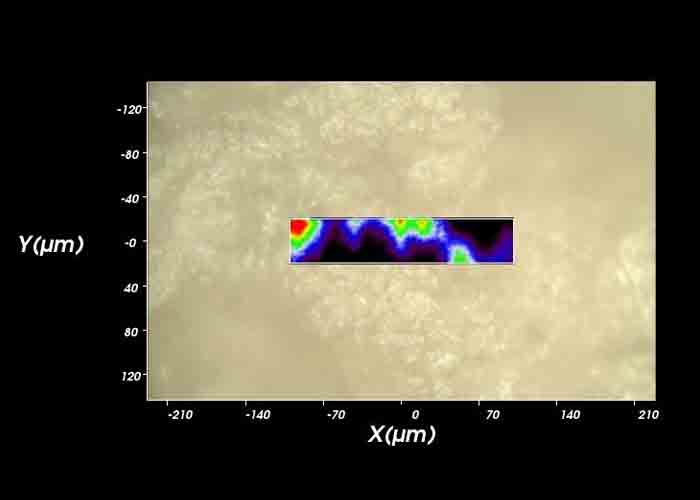
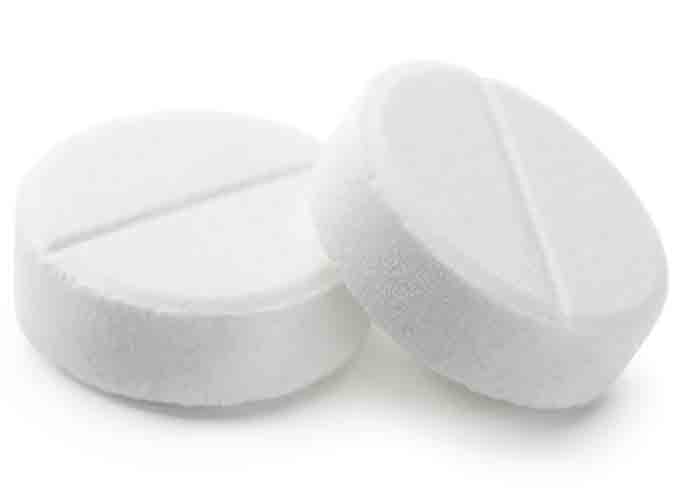
Unlike most analytical techniques, Raman mapping does not require drug product samples, like tablets or granules, to be rendered into powders to be analyzed. The samples can be analyzed as-is. This technique allows for the acquisition of detailed knowledge of the distribution of chemical entities of interest across an exposed inner surface of a manufactured sample (tablet/granule). A Raman map can provide valuable information about the different processes and all the materials used in making the sample. Uniform distribution of an API across a tablet or the chemical consistency of one granule compared to another in a granulated drug product are but two examples of uses that this technique can help address. Raman mapping of drug products is also a very useful way to probe for patent infringement, whether it be to find evidence of an infringing polymorph or to detect coatings or co-localization of ingredients defined in the patent. An example of a Raman mapping application of a tablet is shown to the right. In this case, the client wanted to understand why a certain batch of tablets was failing dissolution. The red/green areas in the image represent the API. Whereas most of the API areas are rather small and likely represent individual API particles, there is a large cluster (or agglomeration) of API particles on the far left portion of the image. The agglomeration was determined to be the cause of the failed dissolution results.

Raman Mapping Application Two: Chemical Sameness
Whenever a process changes, whether it be with the vendor or with the process parameters, it’s important to understand if these changes have any appreciable impact on the end result. Raman Mapping is an excellent tool for determining the sameness of two materials. By probing the chemical makeup of samples at high spatial resolution, chemical consistency between samples can be determined. This approach is also very valuable when batches (API or formulation mixtures) that should be equivalent are found by another technique (such as dissolution) to be different. Oftentimes, Raman mapping provides the answers that other techniques cannot.

Raman Mapping Application Three: Chemical Mapping-Coating
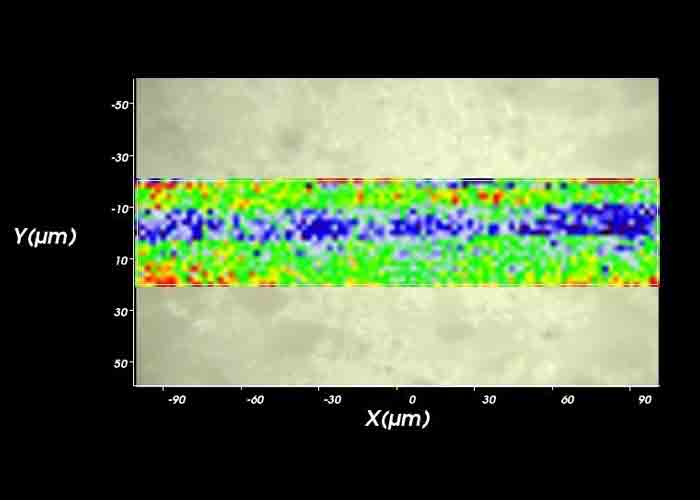
Whereas the first application examined distribution of components throughout a tablet, there is often a need to understand what’s happening on the surface of a tablet. Raman mapping can identify gaps in the coating of a product highlighting the effectiveness and potential shortcomings of a coating system by targeting the chemical signal of the coating material. Because spectra are collected at each point, it is also possible to detect if the coating failures have resulted in any chemical degradation or polymorph changes of the sample. The image to the right is an area map profile of a section of a tablet with a crack. The red/green areas represent the coating. A gap in the coating is clearly present, as indicated by the blue area. Individual spectra from this blue area were extracted from the map and interpreted, revealing that the entire coating had split in some areas exposing the API core underneath.

Raman Mapping Application Four: Bulk mapping
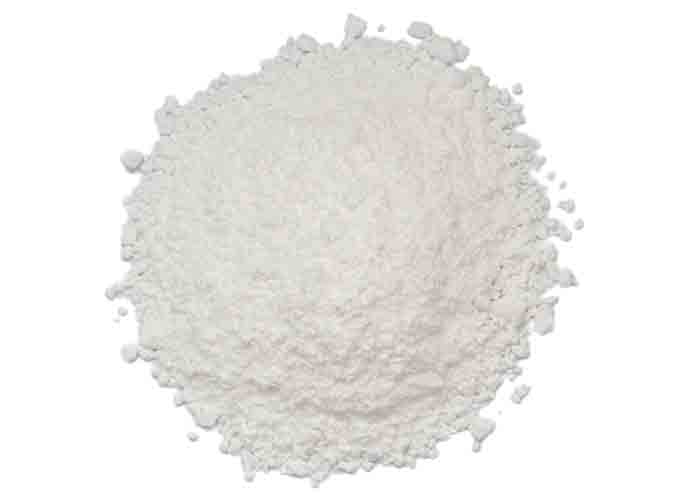
When analyzing a bulk material, such as a powder or mixture, most analytical techniques provide information only on the sample as a whole. Raman mapping, however, can probe the chemical heterogeneity of these materials with high spatial resolution and molecular specificity across a large sample size. One can assess the homogeneity of the whole sample or the distribution of a particular component over a more representative sample size. Such an analysis might be important when developing manufacturing processes or when preparing synthetic mixtures for use in solid-state method development methods.

