 How to quantitate a solid form in your drug product.
A very important aspect of pharmaceutical mixture analysis is detecting and possibly quantitating a specific solid form in a drug product, especially tablets. Chapter 22 of Solid-State Properties of Pharmaceutical Materials by Byrn, Zografi, and Chen (Wiley, 2017) outlines several approaches to mixture analysis. Many of these approaches were pioneered by SSCI in the early 2000s and have been advanced at Improved Pharma. Solid-state method development for drug products requires a rigorous approach to address sample homogeneity, and future blogs will go into more detail on this approach. This blog will focus on the the detection of small amounts of an undesired form.
Can you detect the solid form?
The goal is to determine the presence of a particular form in a drug product, in some cases down to a very low detection limit. A range of methods is available for such a study. Of particular interest are:
- Synchrotron X-ray methods
- Microspectroscopy including Raman and IR
- Solid-state NMR
- Microscopy
However, ATR, gravimetric vapor sorption, NIR, terahertz spectroscopy, and MTDSC have also been utilized. Further, in some cases, PLS modeling has been used to provide further insight into the presence of forms in a drug product.
Griffen and coworkers used Raman spectroscopy with PLS to analyze low levels of a polymorph present in a drug product.1 Raman microscopy has been used for over 20 years.2-3 Solid-state NMR has also been successfully used for the determination of small amounts of a polymorph in drug product.4
Taylor’s group provided two very interesting studies using microscopic methods to detect small amounts of crystalline material in drug products and drug-polymer dispersions.5-6 These studies show the power of various microscopic methods.
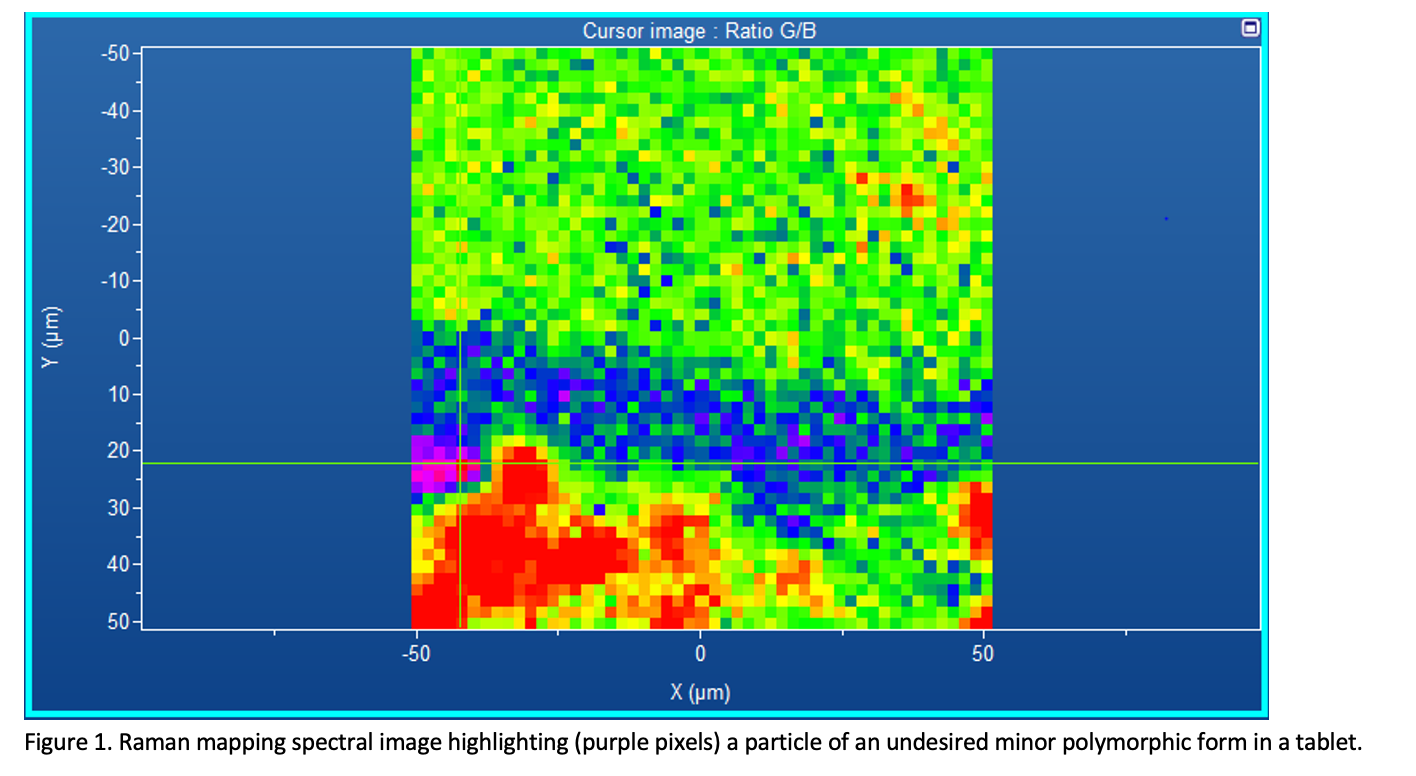
Figure 1 displays the results from some of our own research into detecting low amounts of impurities in a tablet. In the figure, even though the particle is relatively small (~10 microns), it can clearly be detected in the tablet matrix.
When salt disproportionation of your drug substance is an issue.
Salt disproportionation is an undesired process where a salt in the drug product microenvironment disproportionates to the free base. The presence of even small amounts of free base can affect dissolution rate and bioavailability of the salt. Salt disproportionation has been of interest and concern for many years with one of the first salt disproportionation reactions reported for nicotine in the gas phase.7 Recently several studies utilizing sensitive analytical methods have been reported.8 Haichen Nie has been particularly active in this field utilizing a number of methods including Raman microspectroscopy to detect small amounts of free base produced by salt disproportionation.9-12
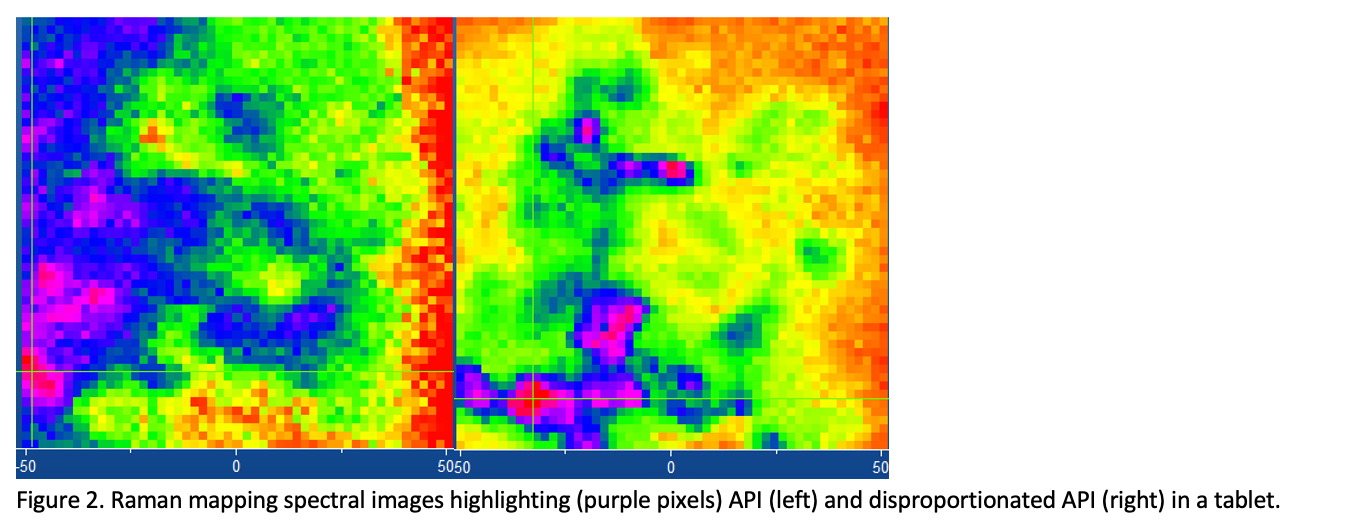
Figure 2 depicts the Raman mapping images of a tablet that has been placed under stress conditions. The mapping region was near the edge of the tablet (the edge is off to the right of the image). The purple pixels in the left-hand image show the location of the API, which is a salt. The purple pixels in the right-hand image represent the disproportionated API, indicating that some of the API has been impacted by the stress conditions. These results indicate that the API closer to the edge of the tablet experiences disproportionation first when the tablet is exposed to stress conditions, which is logical. Clearly, Raman mapping is an excellent technique for not only detecting undesired forms, but showing where they appear in the tablet.
Providing amorphous content analysis.
Determination of the amorphous content of an API in drug product has been addressed by several methods, including Synchrotron X-ray methods, dynamic vapor absorption, DSC, isothermal solution calorimetry, microspectroscopy and solid-state NMR. For example, Crocker and McCauley utilized XRPD to quantify amorphous content for imipenem.13
In summary, these studies and many others in the literature clearly show that it is possible to detect small amounts of unwanted forms in drug products using various methods. Improved Pharma has expertise in this area and has developed methodologies to improve the detection capabilities of polymorphs, amorphous substances, and impurities in drug product.
Want to find out more?
Contact us at info@improvedpharma.com or explore how we improve pharmaceutical methods, formulations, and processes.
Author: Steve Byrn CSO at Improved Pharma.
- Griffen, J. A.; Owen, A. W.; Burley, J.; Taresco, V.; Matousek, P., Rapid quantification of low level polymorph content in a solid dose form using transmission Raman spectroscopy. Journal of pharmaceutical and biomedical analysis 2016, 128, 35-45. https://doi.org/10.1016/j.jpba.2016.05.017
- Sasic, S.; Mehrens, S., Raman Chemical Mapping of Low-Content Active Pharmaceutical Ingredient Formulations. III. Statistically Optimized Sampling and Detection of Polymorphic Forms in Tablets on Stability. Chem. 2012, 84 (2), 1019-1025. https://doi.org/10.1021/ac202396u
- Henson, M.; Zhang, L., Drug Characterization in Low Dosage Pharmaceutical Tablets Using Raman Microscopic Mapping. Spec. 2006, 60 (11), 1247-1255. https://doi.org/10.1366/000370206778998987
- Newman, A. W.; Byrn, S. R., Solid-state analysis of the active pharmaceutical ingredient in drug products. Drug discovery today 2003, 8 (19), 898-905. https://doi.org/10.1016/s1359-6446(03)02832-0
- Newman, A. W.; Byrn, S. R., Solid-state analysis of the active pharmaceutical ingredient in drug products. Drug discovery today 2003, 8 (19), 898-905. https://doi.org/10.1021/acs.cgd.8b01435
- Trasi, N. S.; Purohit, H. S.; Taylor, L. S., Evaluation of the crystallization tendency of commercially available amorphous tacrolimus formulations exposed to different stress conditions. Pharmaceutical Research 2017, 34 (10), 2142-2155. https://doi.org/10.1007/s11095-017-2221-4
- Seeman, J. I.; Fournier, J. A.; Paine, J. B.; Waymack, B. E., The form of nicotine in tobacco. Thermal transfer of nicotine and nicotine acid salts to nicotine in the gas phase. Journal of agricultural and food chemistry 1999, 47 (12), 5133-5145. https://doi.org/10.1021/jf990409b
- Merritt, J. M.; Viswanath, S. K.; Stephenson, G. A., Implementing quality by design in pharmaceutical salt selection: a modeling approach to understanding disproportionation. Pharmaceutical research 2013, 30 (1), 203-217. https://doi.org/10.1007/s11095-012-0863-9
- Nie, H.; Byrn, S. R.; Zhou, Q., Stability of pharmaceutical salts in solid oral dosage forms. Drug Development and Industrial Pharmacy 2017, 43 (8), 1215-1228. https://doi.org/10.1080/03639045.2017.1304960
- Nie, H.; Liu, Z.; Marks, B. C.; Taylor, L. S.; Byrn, S. R.; Marsac, P. J., Analytical approaches to investigate salt disproportionation in tablet matrices by Raman spectroscopy and Raman mapping. Journal of pharmaceutical and biomedical analysis 2016, 118, 328-337. https://doi.org/10.1016/j.jpba.2015.10.024
- Nie, H.; Su, Y.; Zhang, M.; Song, Y.; Leone, A.; Taylor, L. S.; Marsac, P. J.; Li, T.; Byrn, S. R., Solid-state spectroscopic investigation of molecular interactions between clofazimine and hypromellose phthalate in amorphous solid dispersions. Molecular pharmaceutics 2016, 13 (11), 3964-3975. https://doi.org/10.1021/acs.molpharmaceut.6b00740
- Nie, H.; Xu, W.; Ren, J.; Taylor, L. S.; Marsac, P. J.; John, C. T.; Byrn, S. R., Impact of metallic stearates on disproportionation of hydrochloride salts of weak bases in solid-state formulations. Molecular pharmaceutics 2016, 13 (10), 3541-3552. https://doi.org/10.1021/acs.molpharmaceut.6b00630
- Crocker, L. S.; McCauley, J. A., Comparison of the crystallinity of imipenem samples by X-ray diffraction of amorphous material. Journal of pharmaceutical sciences 1995, 84 (2), 226-227. https://doi.org/10.1002/jps.2600840221